ONE44
www.trade144.com
| |
ONE44 |
| How to understand the Intraday Swing Chart |
On the Intraday Swing Point Chart there are three main levels.
The most important level is the one in the middle which represents the actual swing point. The level above (green line) shows where the market can go as long as the market stays above it, or crosses back over. The lower level (red line) is the exact opposite for when the market is under the swing, or crossing back under.
For the more aggressive trader who want to trade more then just the levels provided on the Market Price Ladder, we recommend that you trade from the short side when the market is below the swing point and the long side when the market is trading above the swing point.
The swing points will at times differ from each other based on the timeframe. You can have a situation where the short term is telling you to trade from the long side and the long term swing point from the short side. The short term swing point is obviously more important for the day trader, but the long term swing can help those who want to hold a position for more than just the day.
Our main goal with the Intraday Swing Point Chart is to keep you on the right side of the trend for both short term and long term.
Example 1
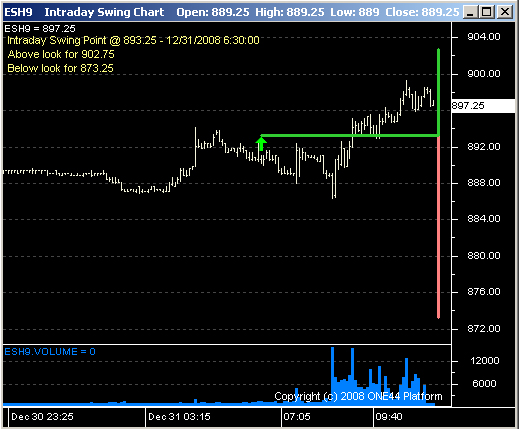 |
Shortly after the swing point was posted on the chart at 6:30 AM CST, you can see the market start to react and trade lower. Once the market has traded back above the swing point, you can see that it plays off of it, never trading through it. This now keeps the upside target intact and indicates that you can take a long position. |
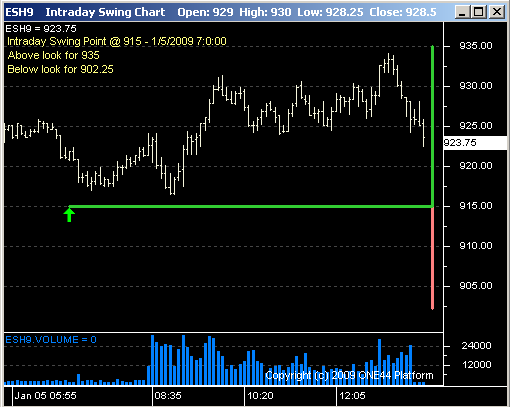
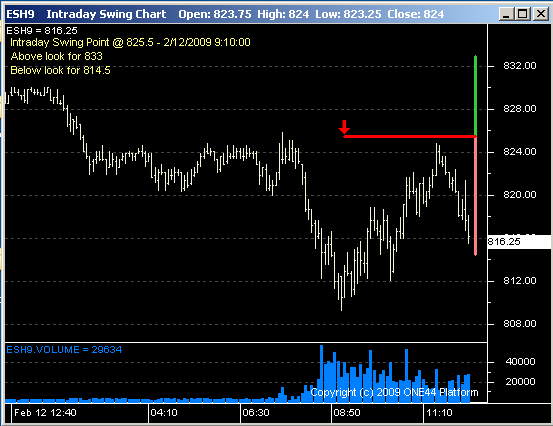
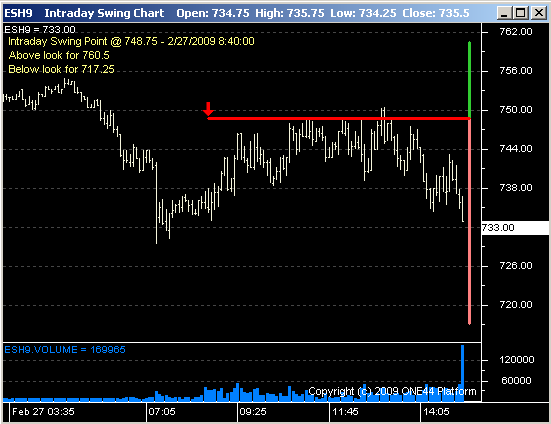
Addition Examples
Please note that the Swing Charts are still beta, if you do not see the swing chart line with the arrow, please right click on the chart and select Intervals > 5 Min to reload the chart.
There will be more examples to follow, please check our blog for updates as well.